County rankings
Where counties stand for Black students
Texas counties ranked by Black graduates enrolling in a Texas college, classes of 2020-2022 pooled.
·
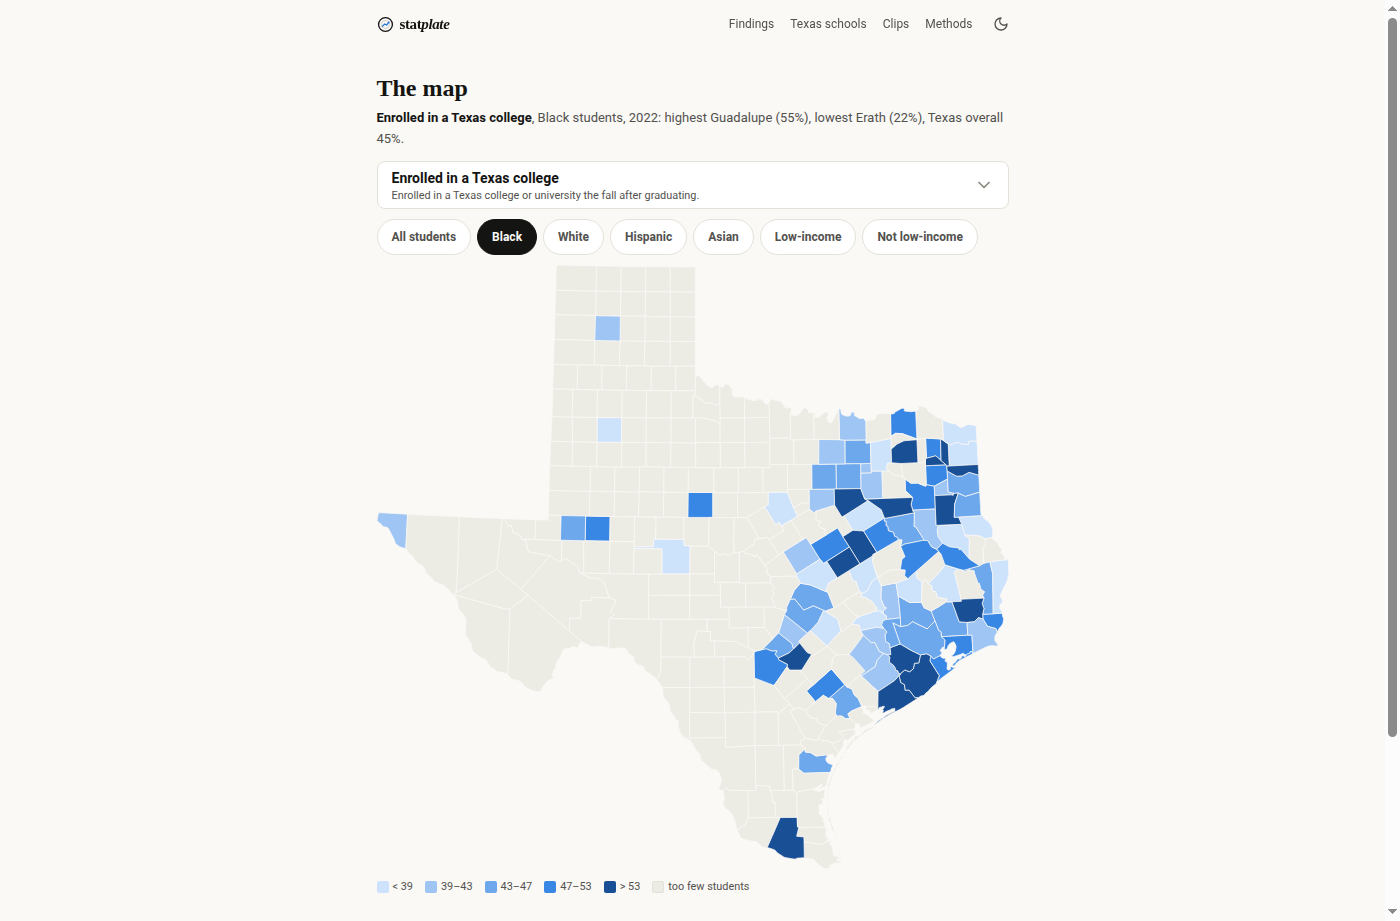
Adding three graduating classes together gives each county enough students for a fair comparison. Only counties with at least 500 pooled Black graduates are ranked.
1. Fort Bend 53.9% n=7,237
2. Brazoria 53.4% n=2,655
3. Ellis 51.8% n=1,128
4. Guadalupe 51.4% n=650
5. Smith 49.4% n=1,334
6. Bexar 48.1% n=4,498
7. Mclennan 47.6% n=1,377
8. Collin 47.4% n=5,758
9. Galveston 47.1% n=2,216
10. Williamson 46.3% n=1,760
11. Montgomery 45.9% n=1,544
12. Potter 45.0% n=520
13. Travis 44.5% n=3,056
14. Kaufman 44.2% n=1,005
15. Gregg 44.2% n=1,121
16. Harris 43.6% n=30,043
17. Dallas 43.1% n=20,946
18. Tarrant 41.0% n=13,870
19. Denton 40.8% n=3,317
20. Jefferson 40.5% n=2,584
21. Bell 38.7% n=3,543
22. El Paso 37.9% n=631
23. Lubbock 36.8% n=810
24. Brazos 36.0% n=906
25. Bowie 33.5% n=934
Fort Bend, Brazoria, and Ellis counties lead. The suburban counties around Houston generally outperform the urban cores, and Montgomery County sits just above the state average.
How does your school compare?
Every Texas campus, every student group, 2012–2025.
Next finding
The famous stat says 78% of NFL players go broke in two years. The bankruptcy records say 1.9%.