Black students statewide score below low-income students of all races, so income alone cannot explain the gap.
· updated ·
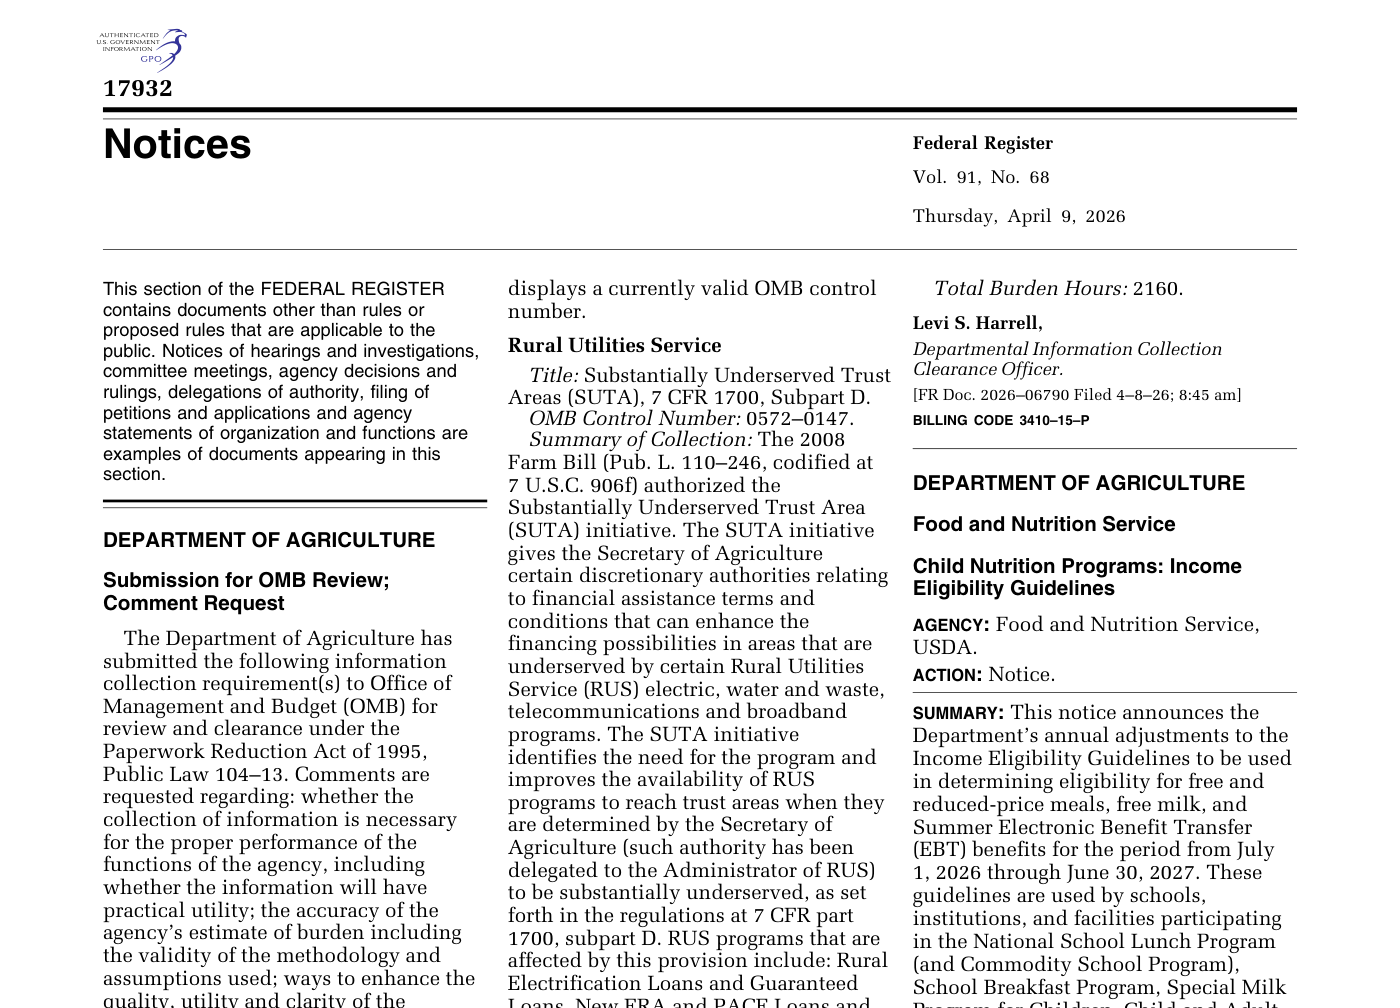
The Federal Register notice setting the 2026-27 income lines for free and reduced-price meals at 130% and 185% of the federal poverty guidelines. That flag is the "low-income" measure in the school data. Captured 2026-08-01. Screenshot: Federal Register / USDA
The most common explanation for race gaps is that they are really income gaps. Texas data lets us test that directly, because the state reports results for low-income students of every race.
26.0%Black students at grade level, Algebra I 2025all Black students, poor and non-poor together
28.7%Low-income students (all races)the poorest slice of every group
43.3%Not-low-income students (all races)
Black students overall, including every middle-class and wealthy Black family, score below the all-races poor average. No mix of poor and non-poor students can average out that way if income were the whole story.
Algebra I, met grade level, statewide
If the race gap were an income gap, the Black line would sit between the low-income and not-low-income lines. It sits below both.
Something at least as large as income's effect does not reduce to income. The strongest candidates in the research: family wealth (which the school-lunch flag can't see, and which differs sharply between Black and White families at the same income), school treatment such as the advanced-course gatekeeping documented on this site, and expectations.
How does your school compare?
Every Texas campus, every student group, 2012–2025.