The instrument
How reliable is Texas school data?
The Texas school pages here run on the Texas Education Agency's numbers, so we audited the instrument itself: thirteen years of raw files, the documented record of the data going wrong, and a test that ends in 2027.
·
Every Texas school statistic here comes from one source: the Texas Education Agency's campus reports. Before trusting them with twelve thousand pages of school data, we scanned every raw download we hold, 4.2 GB across 209 files covering report years 2013 through 2025, and traced the documented record of Texas school data going wrong. The seams are real and countable.
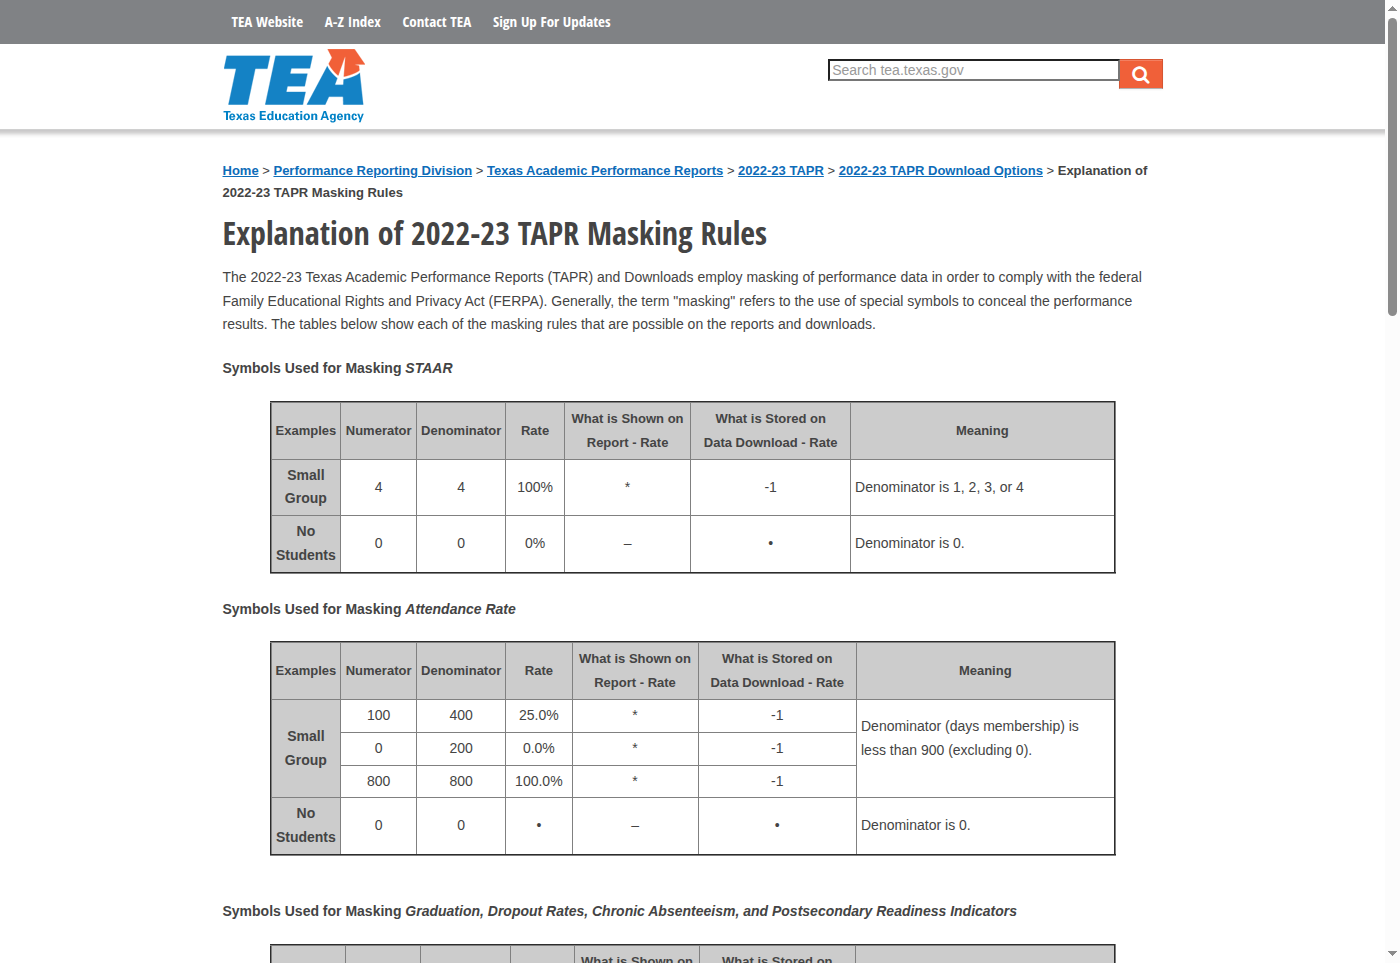
Start with what is missing. When a student group at a campus is small, TEA masks the cell to comply with federal privacy law. In the raw files this is not a rounding error.
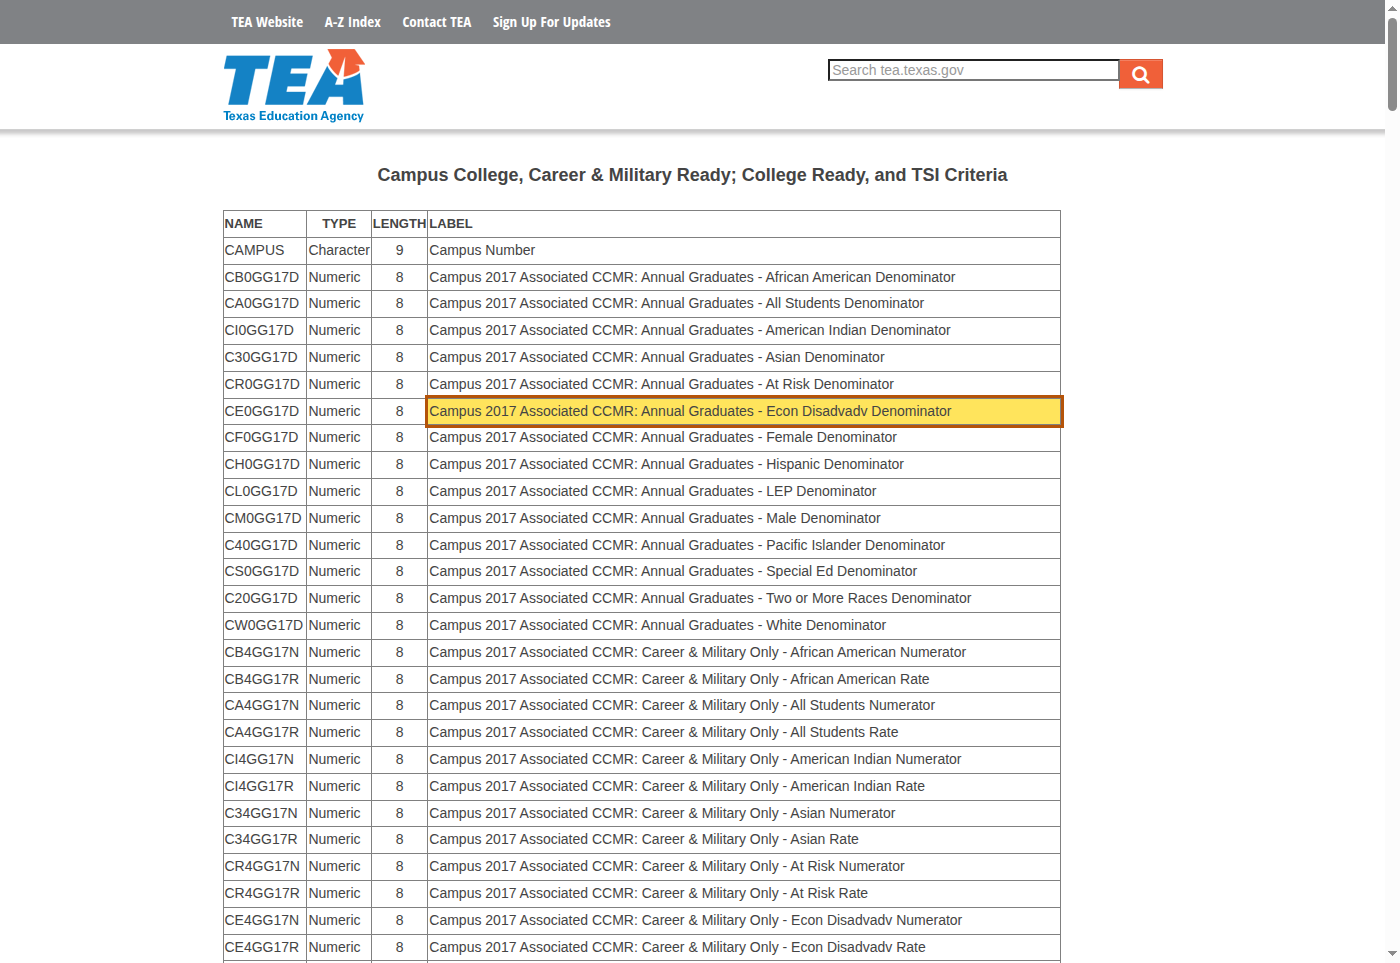
The files also carry the agency's fingerprints. TEA's own data dictionary shipped the label "Econ Disadvadv" for two years, and the typo is still live on the 2019 graduation dictionary page. The all-student group is called "All Students" in every table except college enrollment, where it becomes "All Graduates," a rename that silently dropped a whole series from our own pipeline once before we caught it. And the download packaging itself changed format in 2024, from comma-delimited files that mark absent data with a dot to tab-delimited files that mark it with nothing.
The record
Texas school data has been materially wrong before, at scale. In 2000, Walt Haney concluded that slightly less than 70% of Texas students actually graduated in the 1990s while TEA was reporting a 1.6% annual dropout rate, and quoted a state estimate that TEA's 1994 dropout count "likely covered only half of the actual number of dropouts." A 2003 state audit of 16 Houston schools found more than half of 5,500 student departures should have been counted as dropouts and recommended downgrading 14 of the 16 schools; Sharpstown High had reported zero dropouts in a year 462 students left. When Texas finally adopted the federal dropout definition, the reported rate nearly tripled in one year, from 0.9% (18,290 students, 2004-05) to 2.6% (51,841 students, 2005-06), and TEA's own report says the new data "are not comparable to earlier years."
Toenjes and Dworkin reran Haney's method and concluded that none of the 20-point rise in exit-exam pass rates was explained by dropouts or special-education exemptions, and TEA's leaver-record error rate fell from 6.2% to 0.3% as accountability tightened. The scandal was the dropout counts, not necessarily the learning.
The modern seams are smaller but current. In 2016 the testing vendor lost answers on 14,220 online STAAR exams and Texas assessed a $20.7 million penalty against a $280 million contract. Since December 2023, every English-version STAAR written response is scored first by an automated engine, and the engine's score stands as the score of record for about 75% of responses. In the 2024-25 cycle, roughly 21,600 reading tests were submitted for rescore and 28% changed, with about 70% of rescored third-grade tests statewide coming back higher; TEA's own technical report concludes the hybrid scoring is "accurate, reliable, and fair."
Sometimes the seam is an absence. A court wrote in April 2025 that no A-F school ratings had been issued for five years: none in 2020 or 2021 because of COVID, none for low-performing schools in 2022 for the same reason, and none in 2023 or 2024 because of injunctions won by 121 school districts after the state raised the score needed for an A on one component from 60 to 88 against a class that had already graduated. The underlying data kept publishing on schedule the whole time; the grades on top of it did not. And in February 2025, Houston's KPRC 2 found four years of district self-reports pairing roughly a million truant students a year with zero reported prevention efforts at 13-14% of districts; TEA opened a review only after the station asked, and later conceded it lacks the staff to monitor the data proactively.
This is not a Texas disease
Donald Campbell wrote the general law in 1976: "The more any quantitative social indicator is used for social decision-making, the more subject it will be to corruption pressures and the more apt it will be to distort and corrupt the social processes it is intended to monitor." The evidence since is national. Serious teacher cheating was detected in at least 4-5% of Chicago elementary classrooms a year. Florida schools reclassified low-scoring students into special education when accountability arrived. Kentucky's test gains in the 1990s had, in RAND's words, no echo in the national assessment. State proficiency bars span a range of 60 to 80 points on the national scale. And the gaming was measured in Texas directly: schools manipulated who sat for the test to maximize ratings under the 1990s system.
The same literature carries the defense. The strongest study of Texas accountability found that pressure on low-rated schools produced real gains, students more likely to finish four-year degrees and earning more at age 25, alongside large harms to the lowest-scoring students.
The ruler moves again in 2027
STAAR itself now has an end date. House Bill 8, signed September 17, 2025, sets the last STAAR administration for spring 2027 (grades 3-8) and December 2027 (end-of-course), with a new assessment, the Student Success Tool, from 2027-28. The same law puts accountability definitions on a scheduled five-year refresh with rising rigor and restricts the kind of lawsuit that produced the ratings gap. Definition churn is now scheduled rather than episodic, and every Texas trend line here breaks at that seam.
What these pages do about all of it: masked cells appear as gaps, never zeros; series breaks are drawn as breaks; small groups carry confidence bands; and documents TEA has already let 404 are cited by their archive captures, because the agency's own documentation link-rots. Four of the primary documents behind this story survive only that way.
How does your school compare?
Every Texas campus, every student group, 2012–2025.